on
Custom CPU Temperature Monitoring in Datadog
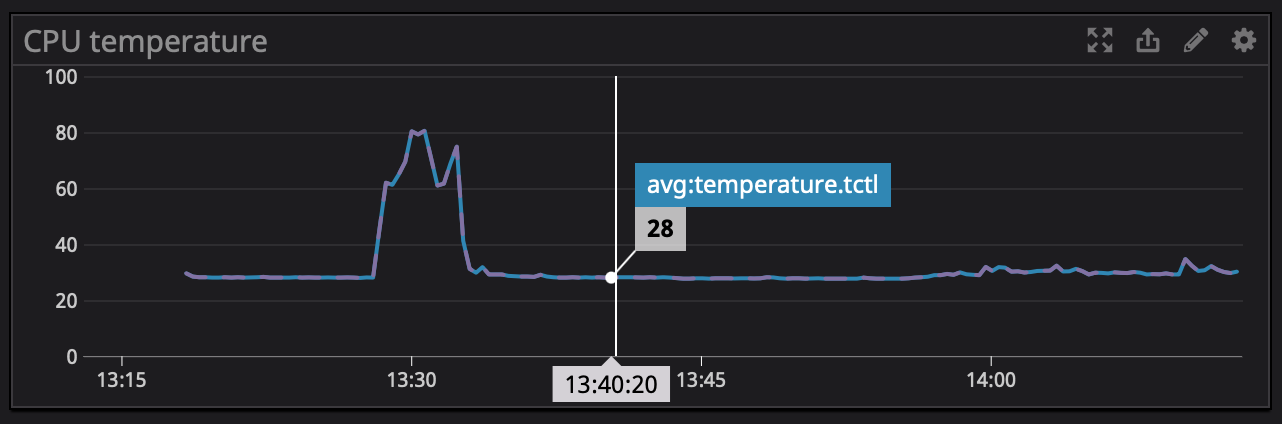
The other day I found myself wondering how hot my machine at home was when it was working on a long-running job. I’ve been using Datadog for simple monitoring, so I wrote a custom ‘Agent check’ to report the CPU temperature as a new metric in Datadog.
Prior to attempting to export metrics to Datadog, ensure your system is properly reporting CPU
temperature metrics. When I run sensors, I can see CPU temperatures reported:
k10temp-pci-00c3
Adapter: PCI adapter
Tctl:         +32.6°C
Tdie:         +32.6°C
...
If this isn’t the case, I would recommend installing/configuring lm_sensors.
Note the CPU I’m running is a Ryzen 9 5950x, which requires Linux 5.10+ for thermal reporting support.
Note the Tctl and Tdie reported by my machine correspond to the “control” temperature (for fan
control, presumably) and die temperature on the CPU, respectively. For my processor the two temperatures are identical, though this isn’t always the case (the
kernel source implements offsets for some processors but not the Zen 3’s).
Other CPU’s might have different thermal monitoring configurations (per-core, etc.).
Since I’d already set up temperature monitoring with Polybar, I mirrored the
functionality in a Datadog Agent check. Polybar leverages Linux’s hwmon (hardware
monitoring) system, which in turn uses the sysfs in-memory filesystem (similar to
/proc) to export metrics to userspace. Polybar then reads the virtual files to
query CPU temperatures. Interestingly, these files implement a query-based API, where the file system’s read
implementation immediately queries the sensor, instead of the virtual file being “updating” at discrete
intervals. In the future I’d like to investigate the libsensors(3) API.
WARNING: The following is an aside on Linux 5.10.13 kernel implementation of CPU thermal monitoring for my processor. Not required to setup the temperature monitoring.
- for AMD processor temperature monitoring in recent (10h+) families, the file
/drivers/hwmon/k10temp.cimplements ak10tempdevice driver (i.e. kernel module)- the driver exposes the temperature-reading functionality through the
k10temp_readfunction- the driver creates/registers a hwmon device (via Linux’s hardware monitoring subsystem) with the
readoperation effectively bound tok10temp_read(see thehwmon_opsstruct)- this driver is initially loaded by defining a
pci_driver,k10temp_driver, which is “probed” when the kernel is booted after determining the device is supported (see Stack Overflow for more).
To follow your way through the kernel source, a rough top-to-bottom ordering is:
k10temp_driver(thepci_driver)k10temp_probe(the main probe function for the device driver)hwmon_dev(the registered hwmon device)k10temp_chip_info(comprises thehwmon_opsbelow and some extra information)k10temp_hwmon_ops(binds hwmon’s read tok10temp_read)k10temp_read(which calls the underlyingk10temp_read_tempto read the actual temperatures)
I found implementing a custom Agent check to be rather straightforward: Datadog provides
docs on creating one and with some simple file handling in Python, everything was
working within half an hour. In order to implement the Agent check, a Python script uses Datadog’s
API to report the metric and a yaml file instantiates the check (both of which are embedded in
Datadog’s config directory). Datadog configs are usually in /etc/datadog-agent/ on
Linux. The two files defining the custom check are: temperature.py and
temperature.d/temperature.yaml.
Here’s what my config directory looks like now:
/etc/datadog-agent/
├── auth_token
├── checks.d
│   ├── temperature.py *new*
│   └── temperature.pyc *auto-generated*
├── conf.d
│   ├── disk.d
│   │   └── conf.yaml -> /etc/static/datadog-agent/conf.d/disk.d/conf.yaml
│   ├── network.d
│   │   └── conf.yaml -> /etc/static/datadog-agent/conf.d/network.d/conf.yaml
│   └── temperature.d *new*
│       └── temperature.yaml *new*
└── datadog.yaml -> /etc/static/datadog-agent/datadog.yaml
The Python script does little beyond finding which files contain our specific temperature metrics
and reading them. The sysfs files contain integers (no floating-point ops in the kernel, generally
speaking) representing the temperature in thousandths of degrees Celsius. Since my two
temperatures reported under k10temp are Tctl and Tdie, the following temperature.py
script finds those metrics in hwmon’s sysfs interface and reads them to send as Datadog metrics. To create the custom check within Datadog, the script includes a class that extends the AgentCheck class and overloads the check
method with a custom implementation that calls self.gauge() to export metrics to the
Datadog agent.
import os
import glob
try:
    # first, try to import the base class from new versions of the Agent...
    from datadog_checks.base import AgentCheck
except ImportError:
    # ...if the above failed, the check is running in Agent version < 6.6.0
    from checks import AgentCheck

__version__ = "1.0.0"

def read_file(path):
    if os.path.exists(path):
        with open(path, 'r') as f:
            l = f.readlines()
        return l[0]

""" check CPU temp in linux from hwmon path """
class TemperatureGauge(AgentCheck):
    def check(self, instance):
        # iterate over temperature inputs reported to hwmon
        for f in glob.glob("/sys/class/hwmon/hwmon*/temp*_input"):
            name = read_file(os.path.dirname(f) + "/name")
            temp_name = read_file(f.split('_')[0] + "_label")
            if name and temp_name:
                temp_name = temp_name.strip()
                if name.strip() == 'k10temp': # change for different temperature labels
                    if temp_name == 'Tctl': # change for different temperature labels
                        # print(f)
                        # print("Tctl: ", float(read_file(f)) / 1000 + .5)
                        self.gauge(
                            "temperature.tctl",
                            float(read_file(f)) / 1000 + .5,
                            tags=["env:dev","metric_submission_type:gauge"],
                        )
                    if temp_name == 'Tdie': # change for different temperature labels
                        # print(f)
                        # print("Tdie: ", float(read_file(f)) / 1000 + .5)
                        self.gauge(
                            "temperature.tdie",
                            float(read_file(f)) / 1000 + .5,
                            tags=["env:dev","metric_submission_type:gauge"],
                        )
Finally, the temperature.yaml file is nearly empty, though provides an
initialization for our check so the python script above is loaded and implemented.
From the docs:
The configuration file includes no real information but it is necessary to include a sequence called
instancescontaining at least one mapping, that can be empty.
instances: [{}]
Upon restarting the Agent (something like systemctl restart datadog-agent), your metric should be
available. Check datadog-agent status to ensure it is reporting properly. This has been tested on
Agent v6, and as soon as v7 lands in Nixpkgs, I’ll report with results from v7.